Chapter 12
Dashboard and analytics
· Published by Osentio
The dashboard shows the results of all agents in the workspace; Analytics shows a single agent. The figures and controls are the same in both.
Dashboard
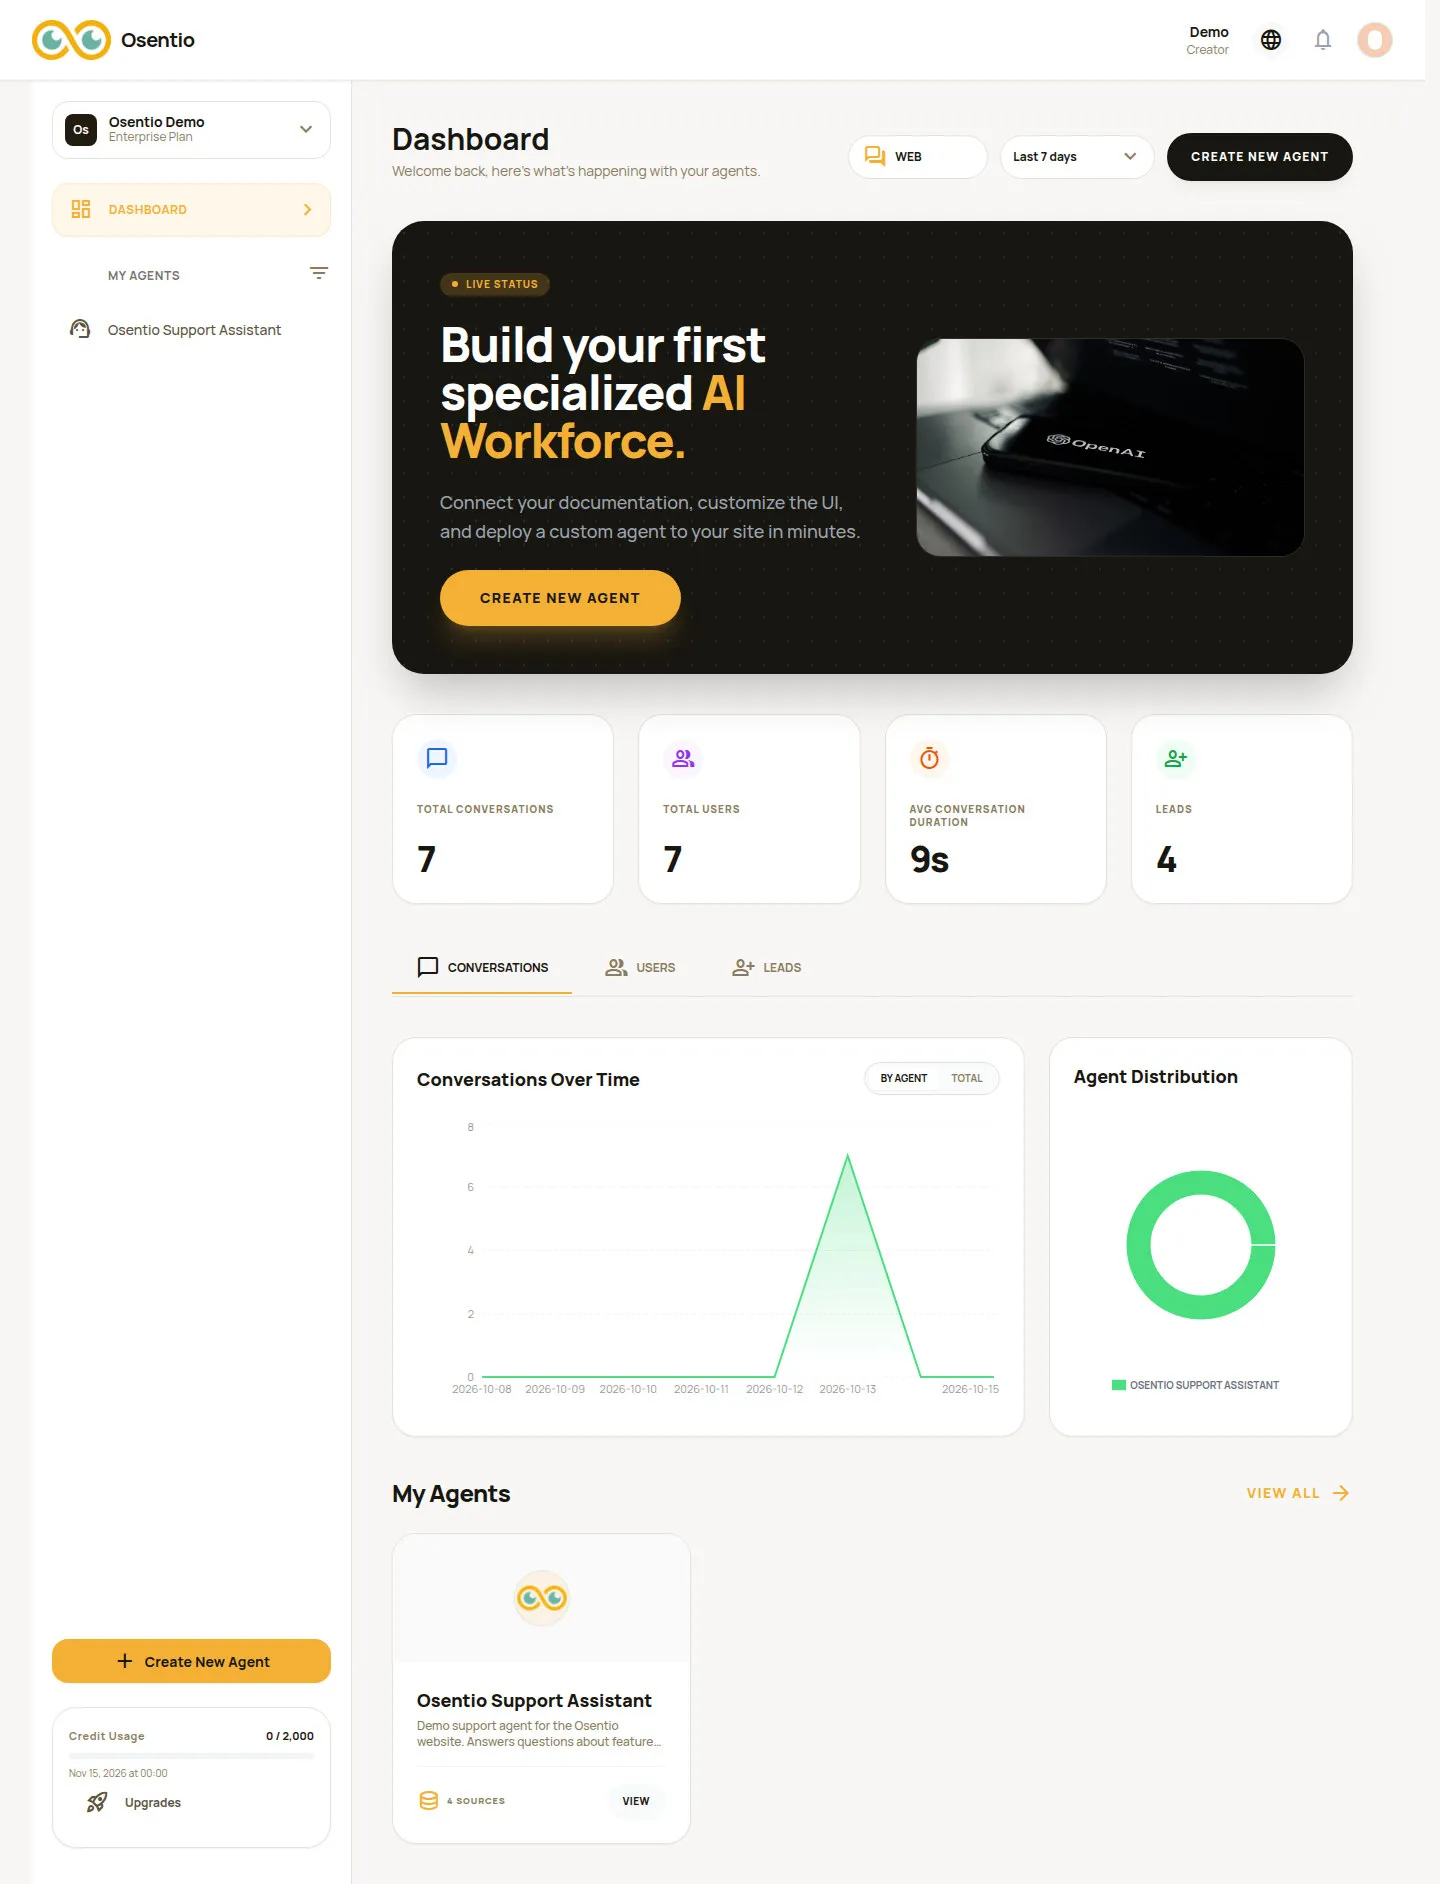
| Figure | Meaning |
|---|---|
| Total Conversations | Number of conversations in the selected period. |
| Total Users | Number of visitors who talked to the agent. |
| Avg Conversation Duration | How long a conversation lasts on average. |
| Leads | Number of leads collected in the selected period. |
- Choose the date range at the top right (Today, Yesterday, Last 7 days, Last 30 days, Custom Range). When several channels have data, you can also filter by source.
- The Conversations, Users and Leads tabs switch the trend chart below. On the dashboard the chart can be shown By Agent or as a Total.
- My Agents at the bottom lists the agents in the workspace. Click View to open one.
Analytics
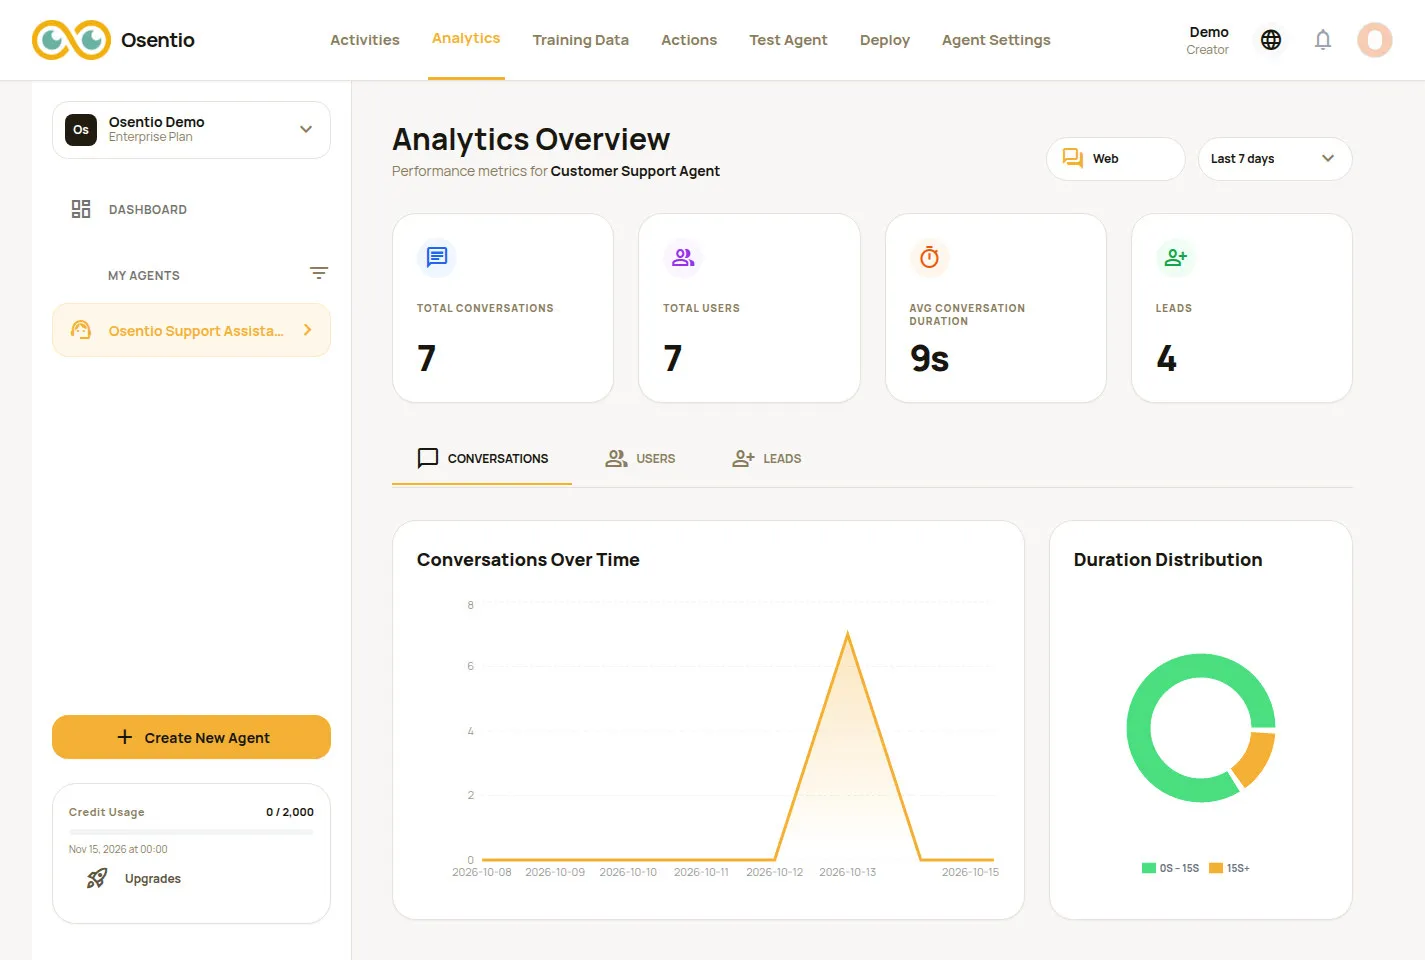
Select an agent and open the Analytics tab. The chart on the right shows the breakdown for the selected tab, such as conversation durations or lead statuses, so you can see how customers interact with the agent.